
TESTIMONY BEFORE THE COMMITTEE OF THE WHOLE AND THE COMMITTEE ON EDUCATION, DISTRICT OF COLUMBIA COUNCIL
Performance Oversight on the District of Columbia Public Schools
Mary Levy February 26, 2019
As an education finance lawyer, a budget and policy analyst, and a DCPS parent, I have studied DCPS data and policies for almost 40 years, including the period when both our daughters were going through DCPS, from pre-kindergarten through grade 12. Below are summaries of some of my recent analyses, but first I want to talk about funding for DCPS local schools.
Last Thursday, DCPS released proposed local school budgets for next year. Although schools were closed for winter break, principals and LSATs were given until Sunday to petition for changes to the many required positions and expenditures, along with another five days to make the limited choices permitted. Parents are reporting that their schools will have to cut staff, even where enrollment has not decreased. We have just received a spreadsheet from DCPS showing all the schools, but I have not yet had time to analyze it to assess these concerns definitively. Nonetheless it is apparent that many schools will suffer higher pupil/staff ratios and less money for supplies and materials because increases are small, while the average staff position costs have almost all risen significantly and budget totals include substantial new sums for security costs now transferred from central accounts.
We do not yet know DCPS total budget for next year, nor where the rest of the money is going, but we do know that DCPS central offices are very expensive and much larger than they once were, and given this, we have to question whether local schools should be losing staff.
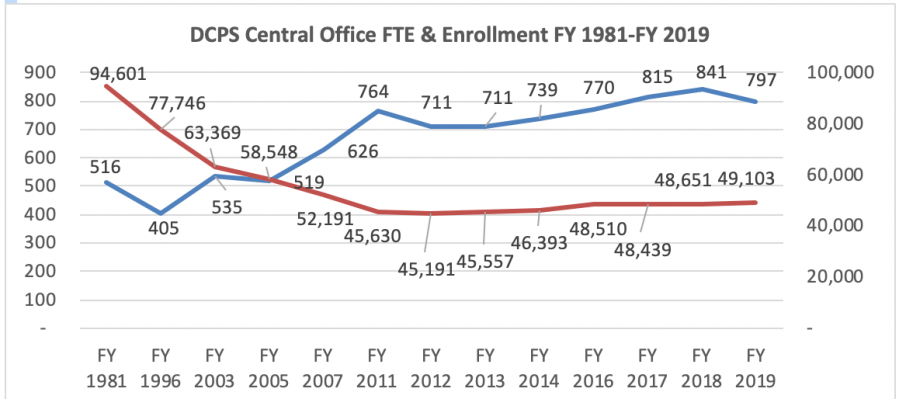
For many years I have categorized DCPS employees by whether or not they serve students directly, which is what most members of the public want to know when they ask about central office or “administration.[1]” The number of central office full-time equivalent staff performing the same functions that DCPS now performs has risen from 516 in 1981, when we had 95,000 students to 626 in 2007, when we had 52,000, to 797 this year for about 49,000.
Below are November 2019 counts of central office staff with common titles. Certainly the system needs some number of these people. Those who are really good are worth a great deal. But do we really need 45 Chiefs and Deputy Chiefs? 86 Directors? 180 Program Specialists?
| Title | # of FTEs | Title | # of FTEs |
| Chief | 14 | Program Specialist | 180 |
| Deputy Chief | 31 | Project Manager | 73 |
| Director | 86 | Coordinator | 144 |
| Manager | 79 | Analyst | 55 |
| Specialist | 84 | Program Coordinator | 9 |
According to the most recent statistics from Census Bureau fiscal reports, DCPS central office spending in FY 2016 was 10.8% of total current expenditures, compared to the U.S. average of 1.9% percent. DCPS is spending $2,260 per pupil, which is ten times the US average of $226.[2] If central office were reduced to a more reasonable level, DCPS would not have to cut local school resources or use at-risk funds to supplant rather than supplement services for at-risk students.
What is happening is all the more painful given that we are spending more money on schools in recent years but seeing only limited academic progress. Since 2007, the District has spent an average of 25% more per pupil in inflation adjusted dollars than in the decade before. Yet DC schools made greater progress on the NAEP assessment in the decade before the mayoral takeover than in the ten years since. The larger NAEP score increases that used to be occurred for all subgroups—low income, black, Hispanic, and special education. The significantly higher spending has brought many benefits, but slower improvement suggests that we need seriously to question the efficacy of recent reforms. As to performance specifics for DCPS:
- Low overall achievement. Scores on the best test available, the National Assessment of Education Progress (NAEP), have increased at about the same rate since at least 2003, but remain dismally low. If one adjusts scores to control for the demographic changes, about two thirds of the DCPS gains since 2003 remain for 4th graders and 8th grade math students, but 8th grade reading gains almost disappear. Comparing the adjusted scores to the big city NAEP average, DCPS 4th graders are improving faster, but remain noticeably lower. DCPS 8th graders improved only a little more in math and not really at all in reading, and remain way below the big city average. PARCC scores, only available for the last four years, resemble NAEP scores, and like them are inching up, but so slowly that it will take decades to reach respectable levels.
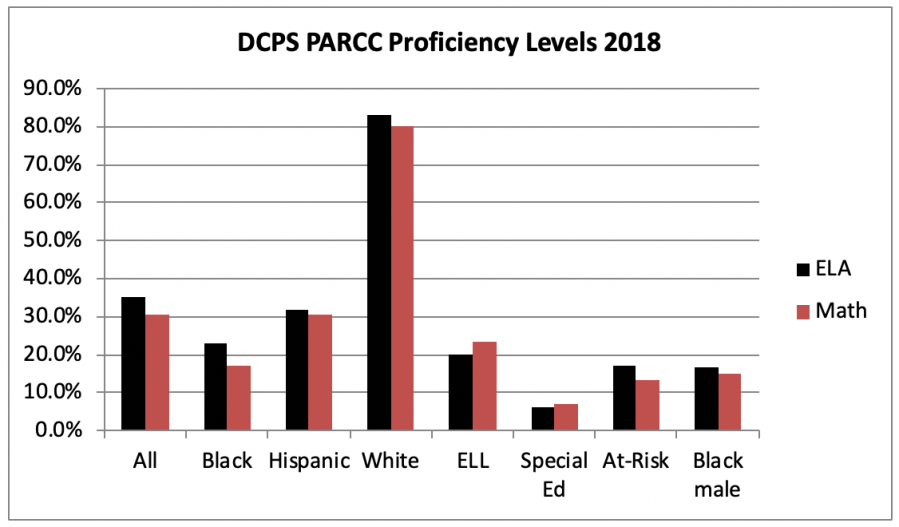
- The lowest achieving groups are black males, at-risk students, and special education students. PARCC score proficiency rates are about 14% for black males and at-risk students and about 7% for special education students. In ten of twelve of our non-selective high schools only a handful of individual students perform at the “college and career ready level.” At the current rate of improvement – about 2% annually – scores for these groups will remain pitifully low for years. Achievement gaps remain horrendous.
Perhaps we could speed rates of improvement by dealing with the following:
- At-risk funds too often supplant rather than supplement other funds. The at-risk funds added by the Council five years ago are now allocated at the same amount per at-risk pupil at every school, but according to my analysis, somewhere between 26% and 45% of at-risk funding in the FY 2019 school budgets supplanted base funds, in contravention of governing law. The unclear 19% is used for mental health professionals, most if not all of whom perform special education services required by law, hence not extra services eligible for at-risk funding. DCPS could, but does not, separate out extra services. The level at which supplanting occurs varies enormously from school to school, and those whose funds are used this way have less, sometimes almost no extra resources dedicated to at-risk students.
- Local school general education funding discrepancies. When funding for the variable special needs (special education, ELL, at risk, and Title I) is filtered out, there are variations of thousands of dollars per student unrelated to academic or other student needs. Such discrepancies are displayed in the C4DC interactive web tool for FY 2018, http://dcpsbudget.ourdcschools.org/. For example, two high-need middle schools with the same size enrollment differ by about $3,000 in their general education per pupil allocations as do two high schools. In addition, individual school funding goes up and down from one year to the next, frustrating the continuity of programming. Figures for next year are currently unavailable.
- “Highly effective” teachers are less available to low-income students. The schools with the highest percentage of teachers rated “highly effective” by the IMPACT system in 2017-18 were in Ward 2 (58%) and Ward 3 (54%). The schools with the smallest percentage of “highly effective teachers” had only half as many: Ward 5 (28%) and Ward 7 (29%). Figures in previous years are similar.
- High levels of teacher turnover generally. System-wide, almost 20% of the entire ET-15 workforce (including counselors, librarians, etc.) leaves DCPS each year. At the school level, 25% leave each year. Over a period of three years, 55% of teachers leave their schools and over five years, 70% leave their schools. These rates are much higher than those of other school districts, including urban districts. Almost half of all newly hired teachers, whether experienced or new to the profession, leave the system within two years; 75% leave within five years of their hiring.
- Staff instability in schools with the highest percentages of at-risk students. In these schools one-third of the ET-15 staff leave annually, compared to 20% of teachers at schools where 20% or fewer of the students are at-risk. Over three or four years some of these schools have almost no continuity. They also change principals more often than other schools.
- High principal turnover ranges in the last six years from 16% to 26%. From last year to this year it was 20%. Research finds that principals need about five years to improve their schools’ performance, but only one-third of DCPS schools this year have principals that lasted that long. Most schools have two or three principals in five years.
- Teachers and students by race/ethnicity. Since 2009-10, DCPS teachers have consistently been about 32% white and about 59% minority, with the remainder not reported. Blacks have made up about 50% of teachers, Latinos have risen from 3% to 7%, and Asians have been 3-4%. Student enrollment in the last six years has gone from 10% white to 15%, from 71% black to 60%, and from 15% Hispanic to 20%.
- DCPS enrollment increased in the last ten years, but not nearly as fast as the school-age population. DCPS is losing almost one percent of market share each year. Attrition of grade level cohorts beginning with 1st grade dipped a little a few years ago but is now rising to earlier levels in the decade. The biggest drop-offs occur between 4th and 5th grades (about 12%-13%) and between 5th and 6th grades (about 33%). One bright spot is that in 28 schools in affluent and gentrifying neighborhoods, in-boundary enrollment has risen in the last ten years by 2,755 students. These schools are thriving. Unfortunately, others are declining.
- Budget transparency is lacking, as is meaningful participation in budget decision-making. Parents and community are invited to state general preferences, but have no opportunity to affect the criteria or other specifics of budget allocation because budgets are announced only when it is too late to change them.
Parents and community have pleaded with DCPS for improvement on all these issues. We need the Council to play its part in advancing the school system in a more constructive direction. Our schools need critical friends.
[1] The source is lists of DCPS employees, obtained by FOIA or from submissions to the D.C. Board of Education (before FY 2008) or to the DC Council (since FY 2008), based on office of employment, program, job title, purpose of applicable grant funding, and DCPS website descriptions. Employees performing functions subsequently transferred or contracted out are excluded in the earlier year calculations.
[2] Derived from U.S. Census Bureau, Public Education Finances: 2016, May, 2018 Tables 6, 7 and 19. https://www.census.gov/data/tables/2016/econ/school-finances/secondary-education-finance.html. These figures are self-reported by DCPS.
.
