
As an education finance lawyer, a budget and policy analyst, and a DCPS parent, I have studied DCPS data and policies for 40 years. Below are results of some of my analyses.
Three weeks ago, DCPS posted proposed local school budgets for next year. A small group of us has downloaded and converted them to spreadsheet, and are still working on systemwide analyses. Preliminary results (numbers may change for a few schools) are that 49 of 115 schools will lose funding. One quarter of these have very small or no enrollment loss. As in previous years, school buying power is down. The average increase is 1.2% while the average teacher cost is rising 1.5%, administrators over 2%, aides 12%, office staff over 13%. No wonder parents are angry about cutting staff.
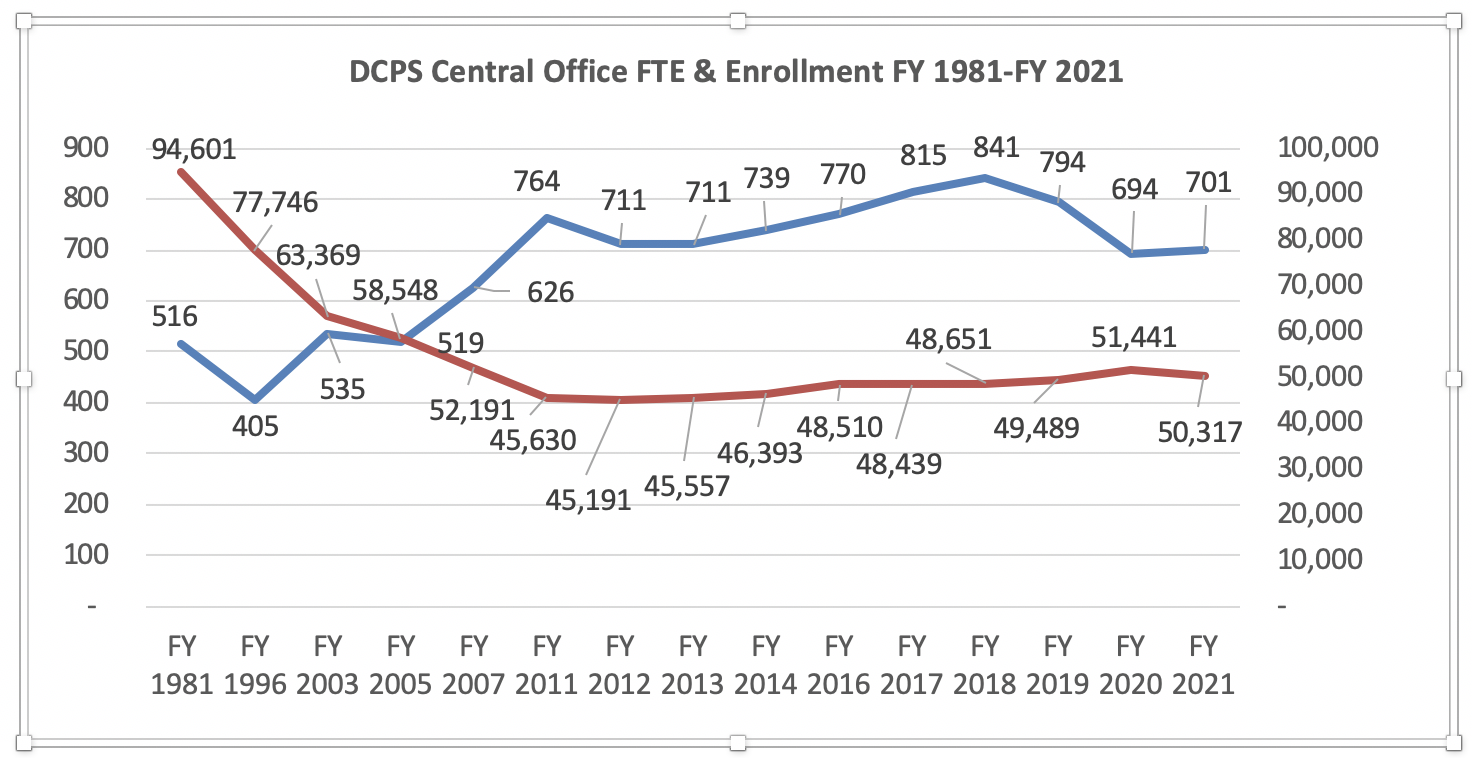
For many years I have categorized DCPS employees by a consistent set of definitions based on whether or not they serve students directly, which is what most of the public want to know when they ask about central office or “administration.”1 The number of central office employees has decreased a little recently, but is still much higher than in years much earlier when enrollment was much higher. Surely some of that cost could go to services in the schools. The number of central office full-time equivalent staff performing the same functions that DCPS now performs rose from 516 in 1981, when we had 95,000 students to 626 in 2007, when we had 52,000, and as of last month to 705 for 50,000. They include 4 Executive Directors, 9 Chiefs, 24 Deputy Chiefs, 75 Directors, 165 Managers and 41 Analysts. The system needs some number of these officials, and those who are good are worth a great deal. But do we really need 35 Executive Directors, Chiefs and Deputy Chiefs? 165 Managers?
1The source is personnel department lists of DCPS employees, obtained by FOIA or from submissions to the D.C. Board of Education (before FY 2008) or to the DC Council (since FY 2008), based on office of employment, program codes, job title, purpose of applicable grant funding, and DCPS website descriptions. Employees performing functions subsequently transferred or contracted out are excluded in the earlier year calculations.
Academic progress is limited, and at-risk students have benefited least from efforts since the mayoral takeover. In the decade after 2007, the District spent an average of 25% more per pupil in inflation adjusted dollars than in the decade before. Yet DC schools made greater progress on the National Assessment of Educational Progress (NAEP) assessment in the decade before the mayoral takeover than in the ten years after. The larger NAEP score increases that occurred before 2007 took place in all subgroups—low income, black, Hispanic, and special education. Increases since have largely belonged to whites and the well-to-do.
The same has been the case with PARCC scores: low scores for at risk and minority group students, and worse for special education students. The lowest achieving groups are black males, at-risk students, and special education students. PARCC score proficiency rates average 18.5% for black males, 17.6% for at-risk students and 8.9% for special education students. In most of our non-selective high schools only a handful of individual students perform at the “college and career ready level.” Scores on both tests inched up again last year, but achievement gaps between low-income and other students were huge and unchanged. Scores on both tests inched up again last year, but achievement gaps between low-income and other students were huge and unchanged.2 At the current rate of improvement – 2-3% annually – scores for these groups will remain pitifully low for years.
Due to the pandemic, the most recent test scores are from 2019.

NAEP results are similar. A sample below:

Although poverty and societal racism generally are factors generally, schools are responsible for at least two factors within their control, the failure to use much of the funding intended for at-risk, special education and English Language Learner students for them, and the continuing churn of principals, teachers, and funding in local schools, particularly those serving these students. Surely we could speed rates of improvement by dealing with the following:
- At-risk funds too often supplant rather than supplement other funds. The at-risk funds added by the Council seven years ago are allocated at the same amount per at-risk pupil at every school, but according to my analyses, in the current year about 40% of at-risk funding in the school budgets supplanted base funds, in contravention of governing law. The level at which supplanting occurs varies enormously from school to school, and those whose funds are used this way have less, sometimes almost no extra resources dedicated to at-risk students. The DC Auditor has made detailed findings on this subject, based on FY 2018 figures, see https://dcauditor.org/report/d-c-schools-shortchange-at-risk-students/
- Mental health services. DCPS uses some at risk funds for mental health professionals, most if not all of whom perform special education services required by law, hence not extra services eligible for at-risk funding. But even with at-risk funds included, the DC Auditor has found that DCPS adjusts funding needed for social workers and psychologists “downward in most cases” at least in low-income schools: 23 schools with the largest concentrations of at-risk students were funded for only 63% of required social worker/psychologist positions, while 19 schools with the lowest concentrations were funded for 125% of their required positions. https://dcauditor.org/report/d-c-schools-shortchange-at-risk-students/, pp. 16-22.
- Local school budgets have been unstable and otherwise problematic. Individual school funding goes up and down from one year to the next, frustrating the continuity of programming and upsetting staff retention. The situation is exacerbated by the failure of funding to keep up with inflation and enrollment increase. In addition, when funding for special needs (special education, ELL, at risk, and Title I) is filtered out, there are variations among schools of thousands of dollars per student unrelated to academic or other student needs. Such discrepancies are displayed in the C4DC interactive web tool for FY 2021, http://dcpsbudget.ourdcschools.org/. I have a spreadsheet with pairs of schools in various parts of the city with the same enrollment, but differences of roughly $2,000 per pupil in their general education allocations.
- “Highly effective” teachers are less available to low-income students. The schools with the highest percentage of teachers rated “highly effective” by the IMPACT system in 2018-19 were in Ward 2 (60%) and Wards 3 and 6 (54%). The schools with the smallest percentage of “highly effective teachers” were those with the highest percentages of at-risk students: Wards 5 and 8 (35%) and Ward 7 (36%). Figures in previous years are similar; figures for last year are not public. See DCPS responses from last year’s Public Oversight Hearings.
- High levels of teacher turnover generally. Teacher retention has improved in the last three years, but turnover remains too high. System-wide, it declined to about 15% from SY 2017 to SY 2020, compared to about 20% in preceding years.[3] Likewise, at the school level, teacher departure declined to 21% in 2018, but as of 2020, according to DCPS, returned to previous levels of about 25%. See https://sboe.dc.gov/sites/default/files/dc/sites/sboe/documents/2019-11-07-FINAL-Teacher%20Attrition%20Report%202019%20%28update%29.pdf and https://dcps.dc.gov/sites/default/files/dc/sites/dcps/page_content/attachments/DCPS-Teacher-Retention-Data-SY2009-2010_SY2018-2019-Final.pdf. These rates are much higher than those of other school districts, including urban districts. Over half of all newly hired teachers, whether experienced or new to the profession, still leave the system within three years.
- Staff instability in schools with the highest percentages of at-risk students. As with teacher turnover generally, these schools have seen a recent dip in staff departures, but still suffer compared to schools where 20% or fewer of the students are at-risk – 30% in the former compared to 20% in the latter over time. They have also changed principals more often.
- High principal turnover continues but has dipped in the last five years to about 16% compared to 25% in the preceding five years, a rate that is comparable to national averages but is still problematic, especially given the critical role of principals in all aspects of school performance. Turnover is considerably higher in schools with higher levels of at-risk students. Research finds that principals need about five years to improve their schools’ performance, but only 48 of 117 DCPS schools as of this year had principals with tenures of 5 years or more. Moreover, while 88% of schools in Wards 2 and 3 have such principals, only 31% of schools in Wards 5, 7 and 8 have principals who have last that long.
Parents and community have pleaded with DCPS for improvement on all these issues with little movement. We need the Council to play its part in advancing the school system in a more constructive direction. Our schools need support and critical friends.
Thank you for the opportunity to testify.
1 The source is personnel department lists of DCPS employees, obtained by FOIA or from submissions to the D.C. Board of Education (before FY 2008) or to the DC Council (since FY 2008), based on office of employment, program codes, job title, purpose of applicable grant funding, and DCPS website descriptions. Employees performing functions subsequently transferred or contracted out are excluded in the earlier year calculations.
2 There was a small improvement in NAEP 4th grade math proficiency, but 8th grade gaps were worse. All gaps are much larger than they were before 2007.
3 These figures are for the entire ET-15 workforce, including counselors, librarians, social workers, etc., but numbers are almost the same for classroom teachers at both the system and school levels.

One thought on “Mary Levy Testimony – Oversight Hearing for Education Agencies – March 9, 2021”